Swing trading is one of the most popular trading styles, popular for its short holding period and its focus on moves that play out over days or weeks. But knowing one breakout strategy isn’t enough. Swing traders need a framework with tested strategies and defined entry and exit points.
Here, we discuss the top five swing trading strategies, what the technical analysis should look like, when to enter, where you're wrong, and when to exit.
CFDs are complex instruments and come with a high risk of losing money rapidly due to leverage. 58% of retail investor accounts lose money when trading CFDs with this provider. You should consider whether you understand how CFDs work and whether you can afford to take the high risk of losing your money.
Key Takeaways
- Swing trading strategy needs a defined entry trigger, an invalidation level where you are sure that your thesis was wrong, and an exit plan before opening a position.
- The main swing trading strategies are trend pullbacks, breakouts, moving average pullbacks, support and resistance trades, and reversals.
What are swing trading strategies?
Swing trading strategies are frameworks that focus on capturing a smaller part of the larger trend, which could last from a few days to a few weeks. Unlike day trading, where positions close the same day, swing traders typically hold positions for several days to a few weeks, not months or years like position trading and long-term investing.
What separates a trading strategy from random trading is having a clear plan. A strategy defines the conditions for entering a trade, what would invalidate the setup, and when to exit. Risk management is also essential, including deciding how much of your trading capital you're willing to risk on each trade.
Trading discipline means following your entry and exit rules consistently rather than changing strategies in response to short-term price movements. This helps traders avoid impulsive decisions and stay focused on their planned setups.
Best swing trading strategies
The five strategies listed here work in different market conditions. Each section walks through a complete framework, from spotting an opportunity to deciding when to get out.
1. Trend Pullback Strategy
The price never moves in a straight line, it goes up, pulls back some of the gains, and then resumes the trend or makes a reversal, vice versa for the downtrend. The trend pullback strategy capitalizes on those retracements before the trend resumes.
On the daily or weekly chart, price should move upward, with each new high generally above the last and dips finding support before they fall too far. Now look at the latest rise and pullback. Traders often look for a pullback toward an earlier support level where the price bounced. From this support, the price should attempt to recover.
Entry: Bullish signals like a rejection candle or a close above the previous candle's high usually trigger the entry. The bullish confirmation shows that buyers are now coming in again after a pullback.
Stop loss: Place the stop loss below the bounce zone, if the zone fails to hold price, the trade thesis is no longer valid.
Exit: The first target is the prior swing high or any important nearby resistance level. A price close below a key moving average, such as the 20-day or 50-day moving average, can also serve as an exit signal for trend followers. Trailing the stop upward as price extends is another option.
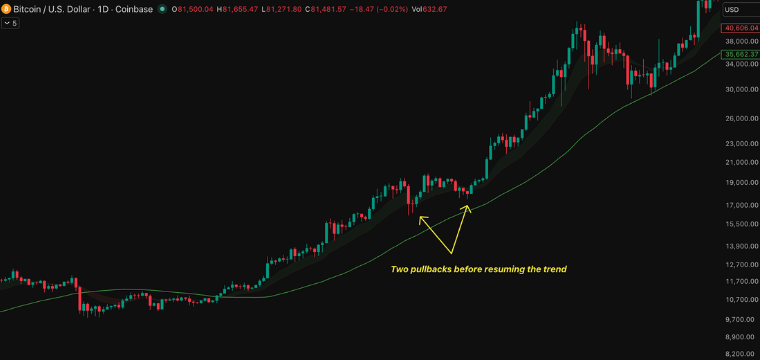
Example: Bitcoin had a strong run in 2020 after recovering from around $3,800 in March. By November, BTC was trading near $19,900. After briefly pulling back, Bitcoin broke above $20,000 in December 2020 and continued rising in the following months.
The market began showing signs of recovery again as higher lows appeared over the next couple of weeks. A trader who entered around $17,800-18,000 placed a stop below $17,500 and looked for a move back toward $20,000. Bitcoin climbed above $20,000 in December and reached around $41,900 in January 2021.
2. Breakout Strategy
Breakout occurs when the market trades within a narrow range for days or even weeks. The price then rises above resistance or falls below support, and the market starts moving again. Traders watch these levels because a break can attract more buyers or sellers, especially when people who were waiting for a clear move finally enter.
Entry: Wait for the candle to close above resistance, with trading volume above its recent average confirming the breakout. Price movements on low volume are easier to reverse, so don't rush into a breakout that lacks buying interest.
Stop loss: Set the stop just below the breakout level. If price falls back below resistance and closes there, the breakout may have failed.
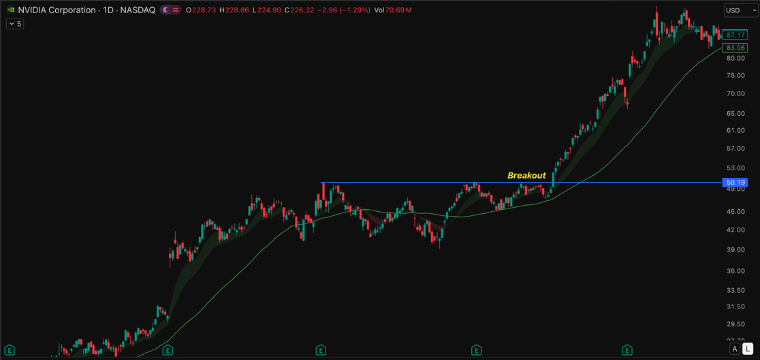
Exit: Measure the height of the consolidation range and add that distance to the breakout level to estimate a target. The next major resistance area is another place to take profit.
Example: In the second half of 2023, NVIDIA (NVDA) was consolidating below the $50 (split-adjusted) resistance for several months. On 8 Jan, 2024, it broke above the resistance with more than double the average volume. For many active swing traders, entry was triggered with a stop below $47, the previous market swing low. NVDA reached $97 in early March 2024.
3. Moving Average Pullback Strategy
The MA pullback strategy is similar to the trend pullback strategy, but here we are looking for a pullback to key moving averages, not structural support levels. Traders look for price holding above a rising SMA or EMA, such as the 20-day, 50-day or 200-day, depending on the trading timeframe.
A pullback toward the MA gives traders a chance to watch how price reacts before deciding whether the trend is still intact.
Entry: Entry is triggered after a bounce, a bullish candle, or a close back above the MA after price briefly dips below it. The signal may indicate that buying pressure is returning.
Stop loss: Place the stop below the recent pullback low. If price breaks well below that level, the bounce may not hold.
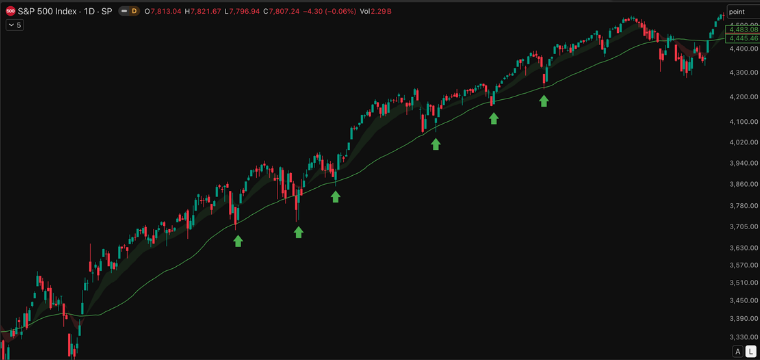
Exit: Take profits near the previous swing high or the next resistance zone. If the trend keeps moving up, you can trail the stop along the moving average to stay in the trade longer.
Example: In the 2021 bull run, the S&P 500 pulled back several times to find support near its 50-day EMA between 3,500 and 4,500 points.. Multiple bullish rejections followed, with price closing above the previous session’s high. An entry on any of the rejections at lower levels would have captured much of the next bull swings in the market.
4. Support and Resistance Strategy
When trading sideways in a zone, price often reacts to areas where it has bounced or rejected before. In a support and resistance strategy, traders use these levels to buy near support and sell near resistance.
More than one touch of the same area confirms a clearer level to watch, but it doesn’t mean that it will do exactly the same next time.
Entry: Wait for price to retouch and see how it behaves there. On the buy side, a trigger signal like a pin bar or a bullish engulfing candle shows buyers stepping in.
Stop loss: For a long trade, place the stop loss below the support zone. For a short trade, place it above the resistance zone. If the price breaks through the opposite side of the trade, the reason for entering the trade is no longer there.
Exit: The nearest resistance or previous swing high gives you a place to plan your exit. You don't have to wait for price to hit the exact level. Sellers may show up early, and the price can turn before it gets there.
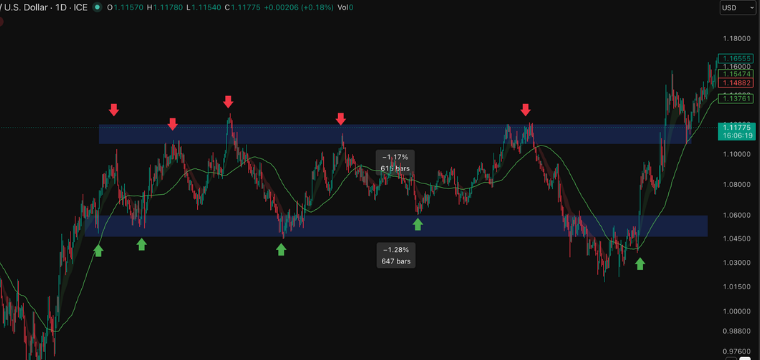
Example: EUR/USD bounced from around 1.0500 several times in 2023. In October, a trader who bought near 1.0520 after price rejected the zone could have set a stop at 1.0450 and aimed for 1.0800, leaving 70 pips at overnight risk for a 280-pip target. The pair climbed back to 1.0800 in November, reaching the target.
5. Reversal Strategy
Reversal strategies are one of the hardest to trade for a swing trader. A trend may look exhausted, then can extend for another week or month and stop out anyone who entered too early. The appeal of a reversal strategy is the early entry, which can allow a tighter stop relative to the potential move. The trade-off is a higher chance of being wrong.
Technical indicators like Relative Strength Index (RSI) divergence help in understanding the signals. A sharp move into a major support or resistance also shows exhaustion.
Entry: Price must be showing clear signs of exhaustion and losing control. In a downtrend, look for a higher low followed by a break above a recent swing high as potential signs of a bullish reversal.
Stop loss: Place the stop beyond the latest low or high that supports the setup. If price makes a new extreme in the old trend's direction, the reversal idea has failed.
Exit: The start of the last major price move is one possible target. Resistance or support may also work as profit-taking zones.
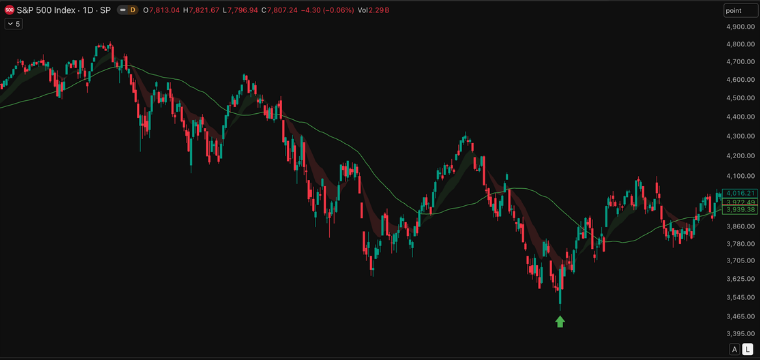
Example: The S&P 500 fell to around $3,491 on October 13, 2022, before beginning a recovery. RSI was higher at the October low than at the June low, despite the further price drop, suggesting bearish momentum was weakening. The index then rebounded, although calling that exact low in real time would have been difficult.
A trader entering around 3,620 with a stop at 3,491 and a target of 3,900 would risk 129 points for a potential 280-point gain, giving a risk-reward ratio of approximately 2.17:1, before transaction costs and slippage. The index moved higher over the following months, reaching around 4,100 in February 2023.
Swing Trading Strategies at a Glance
What is the right swing trading strategy for you?
If you’re newer to swing trading, trend pullback or moving average strategies are often easier to start with because the setups are simpler to identify. Choosing the right strategy or creating your own strategy depends on three things:
- How much time can you give the trade?
- How well do you read chart patterns and financial market structure?
- How much uncertainty can you sit with?
The mistakes traders make are picking a strategy based on what is hot or exciting in the broader market without looking at whether it fits your personality. If you need a quick resolution, a multi-week reversal trade will push you out early.
Assess your risk tolerance. Some swing traders risk around 1% or less of their trading capital per trade, while others accept higher levels of risk. There is no universal rule for how much of an account should be allocated to swing trades; position sizing should reflect your risk tolerance, strategy, and overall portfolio exposure. Figure out your schedule and your temperament first, and it will carve out the right strategy for you.
When swing trading with CFDs, positions held overnight are subject to financing costs. Over a multi-day hold, these add up, so factor them into your exit plan.
Final Thoughts
Knowing how a setup works and trading it live are not the same things. Emotions and judgment happen in real time, so forward testing is one of the best ways to prove a strategy.
If you’re ready to start applying your strategies, for more advanced technical analysis, Change offers access to MetaTrader 5, with professional charting tools and over 80 technical indicators.
CFDs are complex instruments and come with a high risk of losing money rapidly due to leverage. 58% of retail investor accounts lose money when trading CFDs with this provider. You should consider whether you understand how CFDs work and whether you can afford to take the high risk of losing your money.
FAQs
How much capital do you need to start swing trading?
There’s no fixed amount. With CFDs, you trade on margin, so the capital you need depends on position size, leverage, and how much you’re willing to risk per trade. Leverage magnifies losses as well as gains, so only trade with money you can afford to lose.
What is the best time frame for swing trading?
Daily charts are commonly used for swing trading, while weekly and 4-hour charts can provide additional context or help refine entries, depending on the strategy.
How do you calculate the risk-to-reward ratio in swing trading?
Divide the potential profit per share or unit by the potential loss per share or unit. A $6 target with a $2 stop gives a 3:1 reward-to-risk ratio.
How do earnings announcements affect swing trades?
Earnings can trigger price gaps that bypass stop-loss prices, is swing trading profitable for beginners?
Is Swing trading profitable?
Swing trading is not automatically profitable for beginners. The results depend on the individual trader and how their strategy performs in different market conditions.