Most traders burn out their hands chasing short-term trades, but that’s not the only way to capitalize on market movements. Position trading strategy offers a different approach built on patience, high-timeframe analysis, and the ability to capture larger trends without spending hours in front of a screen.
We cover everything from core strategies and the indicators you need to a step-by-step framework you can use to build your position trading setup.
Key Takeaways
- Position trading is a mid- to long-term strategy where trades are typically held for weeks and months, sometimes longer, to capture long term market trends.
- Common position trading strategies include trend following, breakouts, pullbacks, moving average signals, support/resistance, and range/mean-reversion strategies.
What is Position Trading?
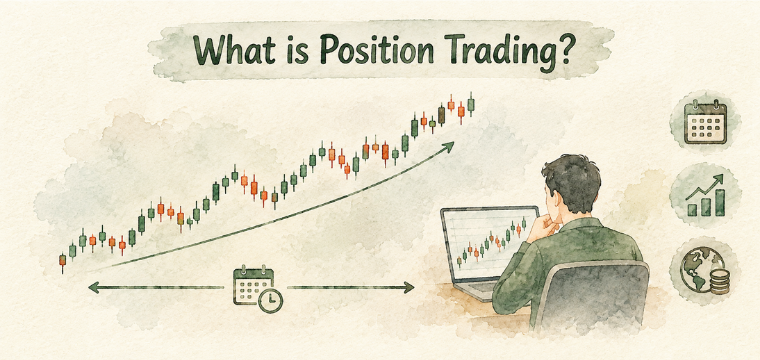
Position trading is a strategy where traders hold a position for an extended period, for weeks or months, and sometimes longer. The aim here is to capture a meaningful part of a larger price trend rather than profit from short-term moves.
Higher timeframe analysis is crucial in position trading, as the trading happens on higher timeframes, like daily or weekly. Both technical and fundamental analysis are given equal importance in position trading.
What mainly differentiates position trading from other trading styles is the holding period. Day traders close their positions within the same day, while swing traders hold for a few days to a couple of weeks. Position traders, on the other hand, are willing to sit through short-term volatility for a larger move to develop.
Position trading can be applied across various markets and trading instruments, including cryptocurrencies, stocks, indices, commodities, and forex.
How does position trading work?
Position trading follows a planned process of holding a trade and expecting long-term value growth. Traders decide what they are looking for, where they will enter, how much they are willing to risk, and when they will exit before placing the trade. This helps prevent hope- or emotion-based decisions once the position is open.
A step-by-step position trading process:
- Select a market: Find an asset showing a clear directional move on the higher timeframes.
- Identify the broader trend and fundamentals: Check the weekly chart to see whether there is trending price action and market sentiment is aligned with the move. Also, check the fundamentals related to the asset, like macroeconomic factors, earnings, sectoral tailwinds, supply-demand disruption, etc.
- Confirm on the daily chart: Move to the daily chart and look for an entry setup that fits with the broader weekly trend.
- Define the entry trigger: Set a clear price or price action signal that tells you when to enter the trade. This could be a technical signal like a breakout of resistance or an inflection point due to some fundamentals.
- Set the stop loss: Analyze every scenario and choose the price level where the trade idea is no longer valid, and the position should be closed.
- Calculate position size: Work out the trade size based on the distance to the stop loss and the amount of account capital you are willing to risk.
- Enter the trade: Open the position when the planned entry conditions are met.
- Manage the position: Monitor the broader trend while the trade is open. If the market moves in your favor, you may adjust the stop loss according to the trading plan.
- Exit the trade: Close the position when the target is reached, the trailing stop is triggered, or the reason for staying in the trade is no longer valid.
Having this process in place makes it easier to stick to the original trade idea. Once the position is open, the focus shifts from finding new reasons to enter to managing the trade according to the plan.
What are position trading timeframes?
Position trading typically uses weekly and daily timeframes, though this can vary by market and strategy.
The weekly chart is usually the starting point for a position trader. It gives a clearer view of the broader trend by filtering out many of the smaller price moves that can distract from the bigger picture. Once the weekly direction is clear, traders can switch to the daily chart to look for a more precise entry.
In faster-moving markets such as crypto, some position traders also use the 4-hour chart to fine-tune their entries. The higher timeframe still carries more weight when deciding the overall direction. These timeframes aren't fixed rules, the right combination depends on the market, the trading strategy, and how long the trader expects to hold the position.
7 Position trading strategies
There is no single best position trading strategy, it depends on risk management and appetite, your analysis method, and the market you're trading.
The seven strategies we are discussing here can be used across different markets and timeframes, but each behaves differently and comes with different risks.
1. Trend Following Strategy
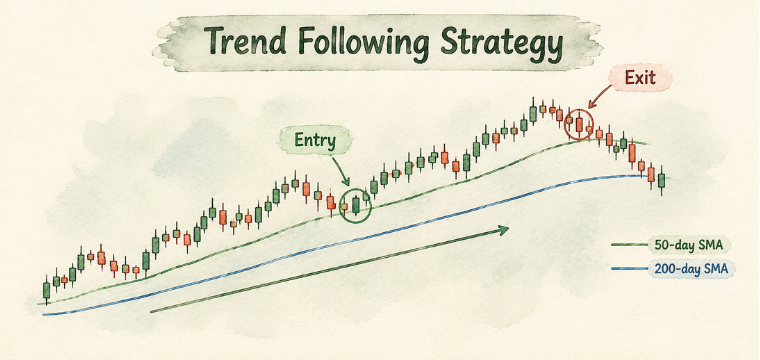
Trend following is one of the most discussed and used trading strategies in the trading landscape. The strategy works on a simple idea of following a market that is moving clearly in one direction, entering in that direction, and staying with the trend until it gives breakdown exit signals.
To confirm a sustained trend, on the weekly chart, look for higher highs and higher lows in an upward trend and lower lows and lower highs in a downward trend. Along with this, price trading above the 50- and 200-day simple moving averages (SMA) can help confirm the direction.
Entry: Look for a breakout to a new high or a pullback toward support within the trend.
Exit: Close the trade when the price structure starts to fail, such as a close below a recent swing low during an uptrend.
The main appeal of trend following is that the trade moves with the market rather than against it. The problem is that a trend is often easier to spot after it has already started. Entering too late can leave less room for the trade to develop and make it harder to maintain a favorable risk/reward ratio.
2. Breakout Strategy
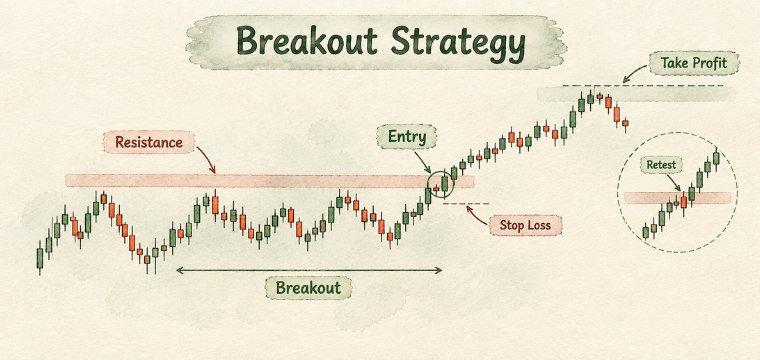
Breakout strategy is another popular trading strategy and is widely adopted. In a trend-following strategy, you look for a low-risk entry to ride the trend, while in a breakout strategy, you wait for price to move through significant resistance or support that has held for an extended period.
Entry: Once the market breaks that level with enough conviction, the trader enters in the direction of the move. A single close beyond resistance does not always mean the breakout will hold. Some traders wait for additional confirmation, such as another close above the level, a successful retest where old resistance becomes support, or a noticeable volume increase.
Exit: The stop loss is typically placed below the broken resistance in a bullish breakout, or above broken support in a bearish breakout. The target can be either the rejection from the next resistance or support or a breakdown of a significant moving average,
3. Pullback Strategy
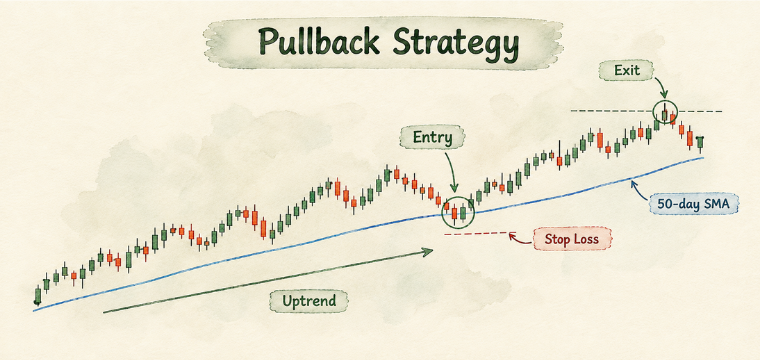
The pullback strategy looks for an entry after a market has already established a trend. Rather than buying after a strong move higher, the trader waits for price to retrace toward a level where buyers may step back in.
A trader may identify an uptrend on the weekly chart and then wait for the price to pull back toward the 50-day SMA on the daily chart.
Entry: If the daily chart then shows signs of a reversal, such as a bullish engulfing candle, the trader can consider a long entry with a stop below the pullback low.
Exit: An exit for a pullback strategy can target a retest of the recent swing high.
Pullbacks can offer a better entry than chasing a breakout because the stop loss can often be placed closer to the entry price. The trade still needs confirmation, though. A falling price is not automatically a buying opportunity simply because the broader trend is bullish.
4. Moving Average Strategy
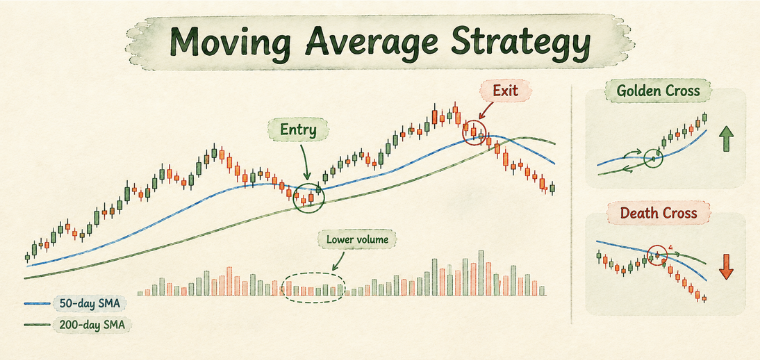
Moving averages are widely used in position trading because they make longer-term trends easier to see without getting distracted by every short-term price move.
The 50-day SMA and 200-day SMA are two of the most commonly used. Price trading above both can support a bullish view, while price below both can point to a weaker trend. Traders also watch for crossovers. When the 50-day SMA moves above the 200-day SMA, it is known as a golden cross and is generally viewed as a bullish signal. The opposite move is called a death cross.
Moving averages can also act as areas of support or resistance.
Entry: For example, price may pull back toward the 200-day SMA during a longer-term uptrend and find buyers there. A decline in volume during that pullback can add support to the idea that selling pressure is fading, although it does not guarantee that the trend will resume.
Exit: Some traders use the opposite signal (e.g., a death cross for bullish positions) as a potential exit trigger.
5. Support and Resistance Strategy
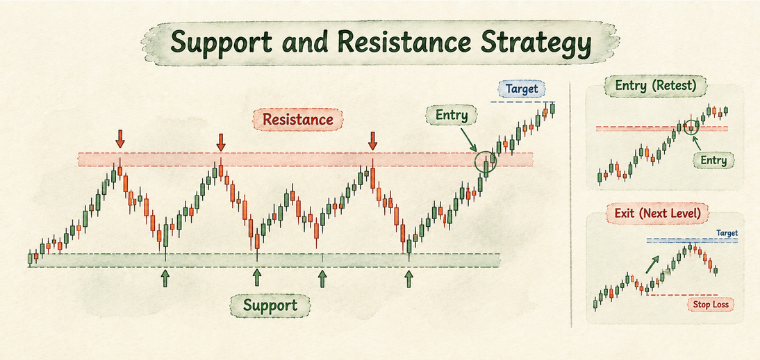
Support and resistance give position traders a way to identify important price areas on higher-timeframe charts. These are levels where price has previously reversed, stalled, or spent significant time consolidating.
Entry: A trader can mark major support and resistance zones on the weekly chart and then wait for one of two things to happen. Price may break through a level and successfully retest it from the other side, or it may reach the level and clearly reject it.
Exit: The stop loss is placed beyond the area being traded, while the next major support or resistance level can provide a potential target.
The advantage of this approach is that major levels are visible to many traders and often attract significant buying or selling activity. Still, a level that has held several times can eventually break, so the setup needs to account for that possibility.
6. Fundamental + Technical Strategy
This approach combines a view of the underlying asset with technical analysis. The fundamental side helps a trader decide which markets or assets are worth watching, while the higher-timeframe chart helps determine when the trade may be ready.
Entry: A trader may observe strong network growth in a cryptocurrency and develop a bullish view based on fundamentals. Rather than entering immediately, it is better for the weekly chart to show signs of a sustained uptrend. The same process can work on the short side. An asset facing regulatory problems or declining adoption may have a weak fundamental outlook, while a weekly breakdown could provide the technical trigger for a short trade.
Exit: The fundamental view can also influence when the trader exits. If the original reason for taking the position changes significantly, there may be little reason to keep holding it even if the chart has not fully reversed yet.
7. Range/Mean-Reversion Strategy
Markets do not always move in clear trends. Sometimes price stays within a defined range for weeks or months, repeatedly moving between established support and resistance. In these conditions, a position trader can look for opportunities near the edges of the range.
Entry: The basic approach is to buy near support and sell or short near resistance, expecting price to remain within the range. This works best when momentum is weak, and neither buyers nor sellers are able to push the price into a sustained trend.
Exit: Target an exit near the opposite side of the range, taking profits near resistance for long positions or near support for short positions.
The main danger comes when the range is about to end. A trader who keeps shorting resistance after an upside breakout can quickly rack up losses, and buying support during a major breakdown can have the same problem.
Best indicators for position trading
Position trading is all about patiently riding a trend. However, tools like technical indicators can help with identification of trend, entry, and exit signals.
- 50day and 200-day SMA: The 50-day and 200-day SMAs are commonly used together to judge the broader trend. When price stays above both, the market generally has a bullish bias, while trading downward shows a weaker trend. A move above creates a golden cross, while a move below creates a death cross.
- RSI: The Relative Strength Index (RSI) measures the momentum on a scale of 0 to 100. Readings above 70 are considered overbought. Readings below 30 are considered oversold. These can signal potential reversals but are not standalone entry/exit signals.
- MACD: MACD helps traders spot changes in momentum and trend direction. Position traders often watch for the MACD line to cross the signal line on daily or weekly charts. Divergence between MACD and price can also point to weakening momentum. Like RSI, it is more useful when combined with price action.
- Fibonacci Retracement: Fib levels can help identify areas where a pullback may find support or resistance. The 38.2%, 50%, and 61.8% levels are the ones traders watch most often. They carry more weight when they match with a significant support or resistance level.
Position Trading vs Swing Trading vs Day Trading
Bottom Line
For traders who want to avoid short-term noise, a well-defined position trading strategy could be an excellent choice. Position traders can trade multiple assets, adjusting their strategies to the specific market.
Change offers multi-asset CFD trading on a single platform. You can trade CFDs on crypto, indices, stocks, forex, and commodities through the platform. Position trading carries risks, so it is important to backtest your strategy before trading with real capital.
CFDs are complex instruments and come with a high risk of losing money rapidly due to leverage. 56% of retail investor accounts lose money when trading CFDs with this provider. You should consider whether you understand how CFDs work and whether you can afford to take the high risk of losing your money.
FAQs
Can beginners use position trading?
Yes, position trading can suit beginners who prefer fewer trades and have the patience to hold through market volatility.
How much capital is typically needed for position trading?
There is no fixed minimum - required capital depends on the market, position size, and risk management approach.
Can position traders use leverage?
Yes, position traders can use leverage, but it can magnify both gains and losses, especially when trades are held for longer periods.
How do position traders manage overnight risk?
Position traders manage overnight risk by using appropriate position sizes, stop losses, diversification, and awareness of major market events.
Can position trading be profitable?
Position trading can be profitable when a trader consistently combines sound analysis, disciplined risk management, and a well-tested strategy. Trading involves high risks. Traders should be aware of these risks.